


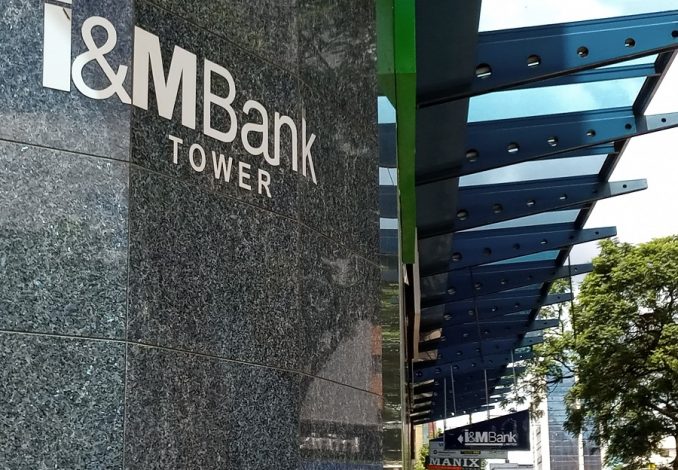
I&M Group posted a strong first half in 2026, with profit after tax climbing 22.4 percent year on year to KES 10.17 billion, as net interest income and total operating income both grew faster than the group’s cost base.
The results, drawn from unaudited financial statements approved by the board on August 26, 2026, show a bank benefiting from expanding lending and a shrinking pile of bad debt at the same time, a combination that doesn’t happen every reporting season.
Income Growth Outpaces Expenses
Net interest income rose 22.5 percent to KES 25.04 billion, while non funded income, the fees, commissions, and trading gains that don’t depend on lending, grew even faster at 24.5 percent to reach KES 8.66 billion. Together, those gains pushed total operating income up 23.0 percent to KES 33.69 billion.
Costs grew too, but not enough to offset the income gains. Total operating expenses rose 27.8 percent to KES 20.56 billion, and loan loss provisions jumped 37.7 percent to KES 5.60 billion, a sharper rise that suggests the bank set aside more caution money even as its existing bad loan book improved. Profit before tax still climbed 16.2 percent to KES 13.13 billion, and after tax, the bank kept 22.4 percent more than it did a year earlier.
Earnings per share rose 20.5 percent to KES 5.35, roughly tracking the pace of profit growth after accounting for the shares outstanding.
Balance Sheet Grows Faster Than Deposits
I&M Group’s total assets grew 26.7 percent to KES 746.3 billion, outpacing growth in customer deposits, which rose 17.7 percent to KES 505.2 billion. That gap between asset growth and deposit growth typically means a bank is funding more of its expansion through other sources, such as borrowed funds or retained earnings, rather than deposit inflows alone.
Net loans and advances grew 15.0 percent to KES 333.8 billion, a slower pace than total assets, meaning some of the group’s expansion came from investment securities or other asset classes rather than new lending. Total equity rose 12.1 percent to KES 119.4 billion, giving the group a larger capital cushion heading into the second half.
Bad Loans Move in the Right Direction
Gross non performing loans fell 12.4 percent to KES 30.11 billion, a rare piece of good news on asset quality in a sector where loan books have often expanded faster than banks can vet borrowers. The decline came even as net loans grew, meaning the bank both lent more and cleaned up its existing book at the same time.
At the bank level, the liquidity ratio told a similar story to what other Kenyan lenders have reported this earnings season: pressure is building from fast loan growth. I&M Bank Limited’s standalone liquidity ratio dropped to 51.79 percent from 57.49 percent a year earlier, still comfortably above the 20 percent regulatory minimum, but a meaningful drop that mirrors a pattern showing up across the industry.
How It Stacks Up Against Peers
I&M’s 22.4 percent profit growth places it among the stronger performers in a crowded Kenyan bank earnings season. DTB reported a 37 percent jump in profit to KES 9.8 billion, driven largely by digital lending, while National Bank of Kenya’s pretax profit more than doubled, though that gain came from falling funding costs rather than stronger core income. Equity Group, meanwhile, is seeing its regional units outside Kenya grow fast enough to reshape the group’s overall numbers.
Unlike National Bank, I&M’s profit growth came from genuine income expansion, both net interest income and non funded income grew by more than 20 percent, rather than from cost cutting alone. That distinction matters for judging how sustainable the growth is likely to be.
I&M Group H1 2026 Results at a Glance
| Metric | H1 2026 | Change YoY |
|---|---|---|
| Total Assets | KES 746.3B | +26.7% |
| Net Interest Income | KES 25.04B | +22.5% |
| Net Loans and Advances | KES 333.8B | +15.0% |
| Total Operating Income | KES 33.69B | +23.0% |
| Non Funded Income | KES 8.66B | +24.5% |
| Loan Loss Provisions | KES 5.60B | +37.7% |
| Total Operating Expenses | KES 20.56B | +27.8% |
| Profit Before Tax | KES 13.13B | +16.2% |
| Profit After Tax | KES 10.17B | +22.4% |
| Total Equity | KES 119.4B | +12.1% |
| Customer Deposits | KES 505.2B | +17.7% |
| Gross NPLs | KES 30.11B | -12.4% |
| EPS | KES 5.35 | +20.5% |
The results were signed on behalf of the board by Chairman Oliver Fowler, Group Executive Director Sarit S. Raja Shah, and Rose W. Kinuthia, Chair of the Board Audit and Risk Management Committee.
Taken together, the half year shows a bank growing its balance sheet aggressively while managing to shrink its bad loan pile, a combination that will draw attention as other Kenyan lenders close out their own reporting this earnings season. Whether I&M can sustain both trends through the second half, especially as loan loss provisions rise faster than the loan book itself, will shape how investors read the group’s next results.
