


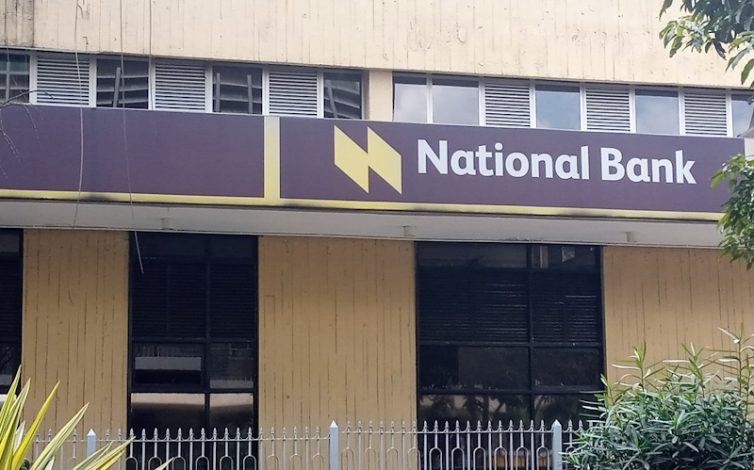
National Bank of Kenya’s pretax profit more than doubled in the first half of 2026, climbing 124.3 percent to KES 2.18 billion for the six months to June 30, according to unaudited results the board released this week.
Profit after tax grew 60.5 percent to KES 1.72 billion, and earnings per share rose 61.9 percent to KES 0.68. Director L. Omangi and Acting Managing Director J. Ojalla signed the results on the board’s behalf.
The jump came from what the bank stopped paying out. Interest expense fell 29.0 percent to KES 1.80 billion, even as total interest income slipped 2.7 percent to KES 7.20 billion. That gap between falling costs and roughly flat income pushed net interest income up 11.0 percent to KES 5.40 billion, the engine behind the bank’s stronger bottom line.
Non interest income held largely steady, down just 0.8 percent at KES 1.47 billion. Combined with the net interest income gain, total operating income rose 8.2 percent to KES 6.87 billion.
Balance Sheet Growth Outpaces Liquidity
The balance sheet tells a more complicated story than the profit line. Total assets grew 18.9 percent to KES 157.09 billion, and net loans and advances jumped 38.4 percent to KES 61.28 billion, a sharp acceleration in lending relative to the bank’s income growth. Customer deposits rose 16.1 percent to KES 116.34 billion, and total shareholders’ funds increased 18.7 percent to KES 18.41 billion.
That faster lending came at a cost to the bank’s liquidity cushion. The liquidity ratio at the bank level fell to 61.1 percent, down from 69.5 percent a year earlier, a signal that National Bank is deploying more of its balance sheet into loans rather than holding it in reserve. Core capital still grew 16.8 percent to KES 12.01 billion, and total capital rose 7.4 percent to KES 15.37 billion, so the bank remains well capitalized even as its liquidity buffer thins.
Asset quality moved in the wrong direction, though modestly. Gross non performing loans at the bank level rose 3.2 percent to KES 17.85 billion, a pace worth watching given how quickly the loan book expanded over the same period.
How It Compares
National Bank’s results land in the middle of a busy reporting season for Kenyan lenders. DTB posted a stronger half, with profit climbing 37 percent to KES 9.8 billion on the back of digital lending growth, while Equity Group’s regional units outside Kenya are now growing fast enough to reshape the group’s overall story.
Against that backdrop, National Bank’s headline profit growth looks striking, but it’s worth noting that the gain came from lower funding costs rather than from expanding the core lending business, a different growth pattern than peers reporting income driven gains.
H1 2026 Results at a Glance
| Metric | H1 2026 | Change YoY |
|---|---|---|
| Total Interest Income | KES 7.20B | -2.7% |
| Total Interest Expense | KES 1.80B | -29.0% |
| Net Interest Income | KES 5.40B | +11.0% |
| Total Non Interest Income | KES 1.47B | -0.8% |
| Total Operating Income | KES 6.87B | +8.2% |
| Profit Before Tax | KES 2.18B | +124.3% |
| Profit After Tax | KES 1.72B | +60.5% |
| Earnings Per Share | KES 0.68 | +61.9% |
| Total Assets | KES 157.09B | +18.9% |
| Net Loans and Advances | KES 61.28B | +38.4% |
| Customer Deposits | KES 116.34B | +16.1% |
| Total Shareholders’ Funds | KES 18.41B | +18.7% |
| Core Capital (Bank) | KES 12.01B | +16.8% |
| Total Capital (Bank) | KES 15.37B | +7.4% |
| Gross NPLs (Bank) | KES 17.85B | +3.2% |
| Liquidity Ratio (Bank) | 61.1% | vs 69.5% prior year |
The numbers point to a bank whose profit recovery is real but narrow, built more on cheaper funding than on stronger core earnings.
Whether that holds through the second half will depend on how National Bank manages the trade off between its fast growing loan book and its shrinking liquidity buffer, particularly if non performing loans continue climbing at the current pace.
