



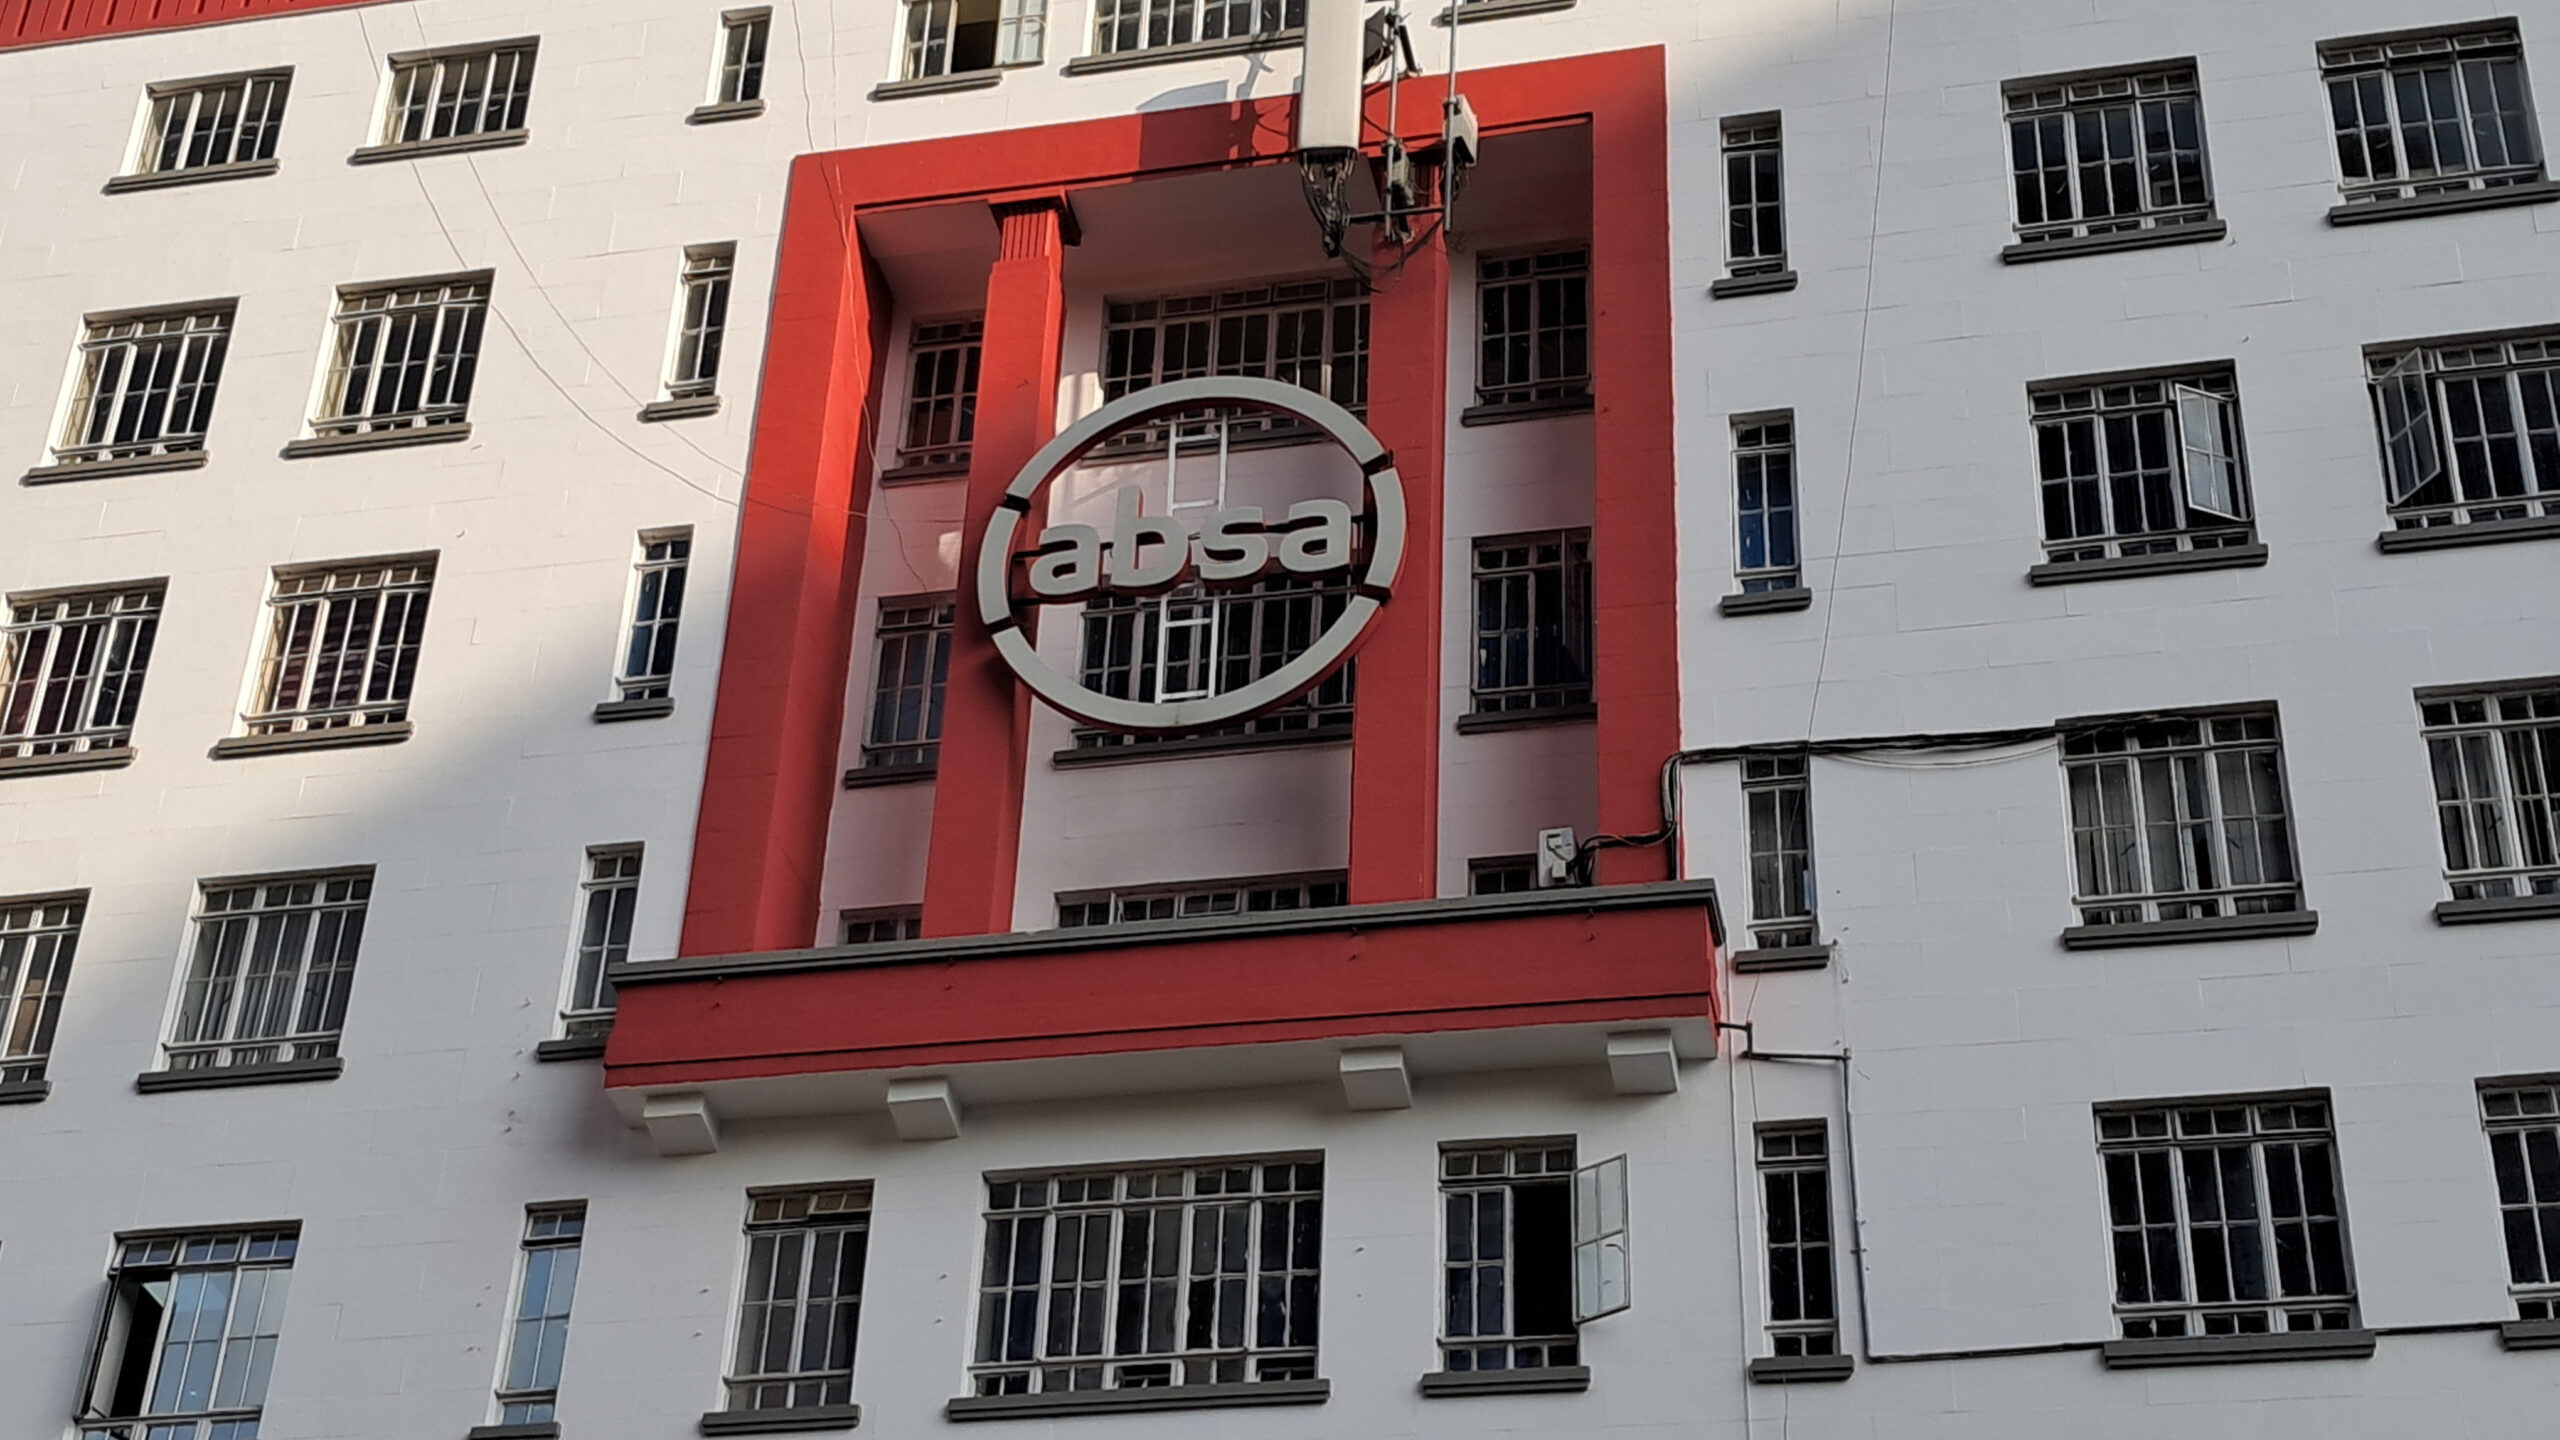
Absa Bank Kenya recorded its first decline in quarterly profit after tax since 2017, as falling interest rates squeezed revenue across both funded and non-funded income lines and a sharp, unexplained surge in staff costs added pressure to an already compressed margin environment.
The bank posted a profit after tax of KSh 5.31 billion for the three months ended March 31, 2026, down 13.9% from KSh 6.17 billion in the same period a year earlier — a peak that now marks the high watermark before the current pullback. The result represents only the second revenue contraction in 20 years of available quarterly data, the first being a single-year dip during the global financial crisis in 2009.
Q1 2026 Financial Snapshot
| Metric | Q1 2025 | Q1 2026 | Change |
|---|---|---|---|
| Profit after tax | KSh 6.17B | KSh 5.31B | -13.9% |
| Total revenue | KSh 15.77B | KSh 14.65B | -7.1% |
| Net interest income | KSh 11.26B | KSh 10.37B | -7.9% |
| Non-interest income | KSh 4.51B | KSh 4.28B | -5.2% |
| Loan interest income | KSh 11.49B | KSh 9.97B | -13.2% |
| FX trading income | KSh 1.54B | KSh 1.26B | -17.9% |
| Interest expense | KSh 3.80B | KSh 3.15B | -17.2% |
| Total operating expenses | KSh 6.99B | KSh 7.16B | +2.4% |
| Staff costs | KSh 2.91B | KSh 3.89B | +33.7% |
| Cost-to-income ratio | 44.3% | 48.9% | Deteriorated |
| Total assets | KSh 537.5B | KSh 571.3B | +6.3% |
| Customer deposits | KSh 372.3B | KSh 399.1B | +7.2% |
| Gross NPLs | KSh 44.06B | KSh 38.11B | -13.5% |
| Government securities | KSh 105.90B | KSh 128.46B | +21.3% |
Rate Cuts Erode Loan Income Faster Than They Cheapen Funding
Operating revenue fell 7.1% to KSh 14.65 billion — the second consecutive annual decline and the first back-to-back drop in at least two decades of available data. The Central Bank of Kenya’s rate-cutting cycle fed directly through to variable-rate asset yields, driving loan interest income down 13.2% to KSh 9.97 billion.
Foreign exchange trading income retreated 17.9% to KSh 1.26 billion, pulling back from the elevated levels recorded during the shilling depreciation cycle of 2023 and 2024. Non-interest income slipped 5.2% to KSh 4.28 billion.
The bank’s interest expense fell 17.2% to KSh 3.15 billion as deposit repricing moved in its favour. That relief, however, could not offset asset yield compression. Rate cuts are eroding the loan book faster than they are cheapening funding — a dynamic that puts direct pressure on net interest margins and that no amount of cost-of-funds management fully neutralises in a falling-rate environment.
One genuine bright spot: subsidiary income grew 25% year on year, pointing to early traction in the bank’s effort to diversify revenue beyond the core Kenya balance sheet.
Managing Director and CEO Abdi Mohamed acknowledged the pressures while framing them as cyclical rather than structural. “It has been a demanding period for our customers and the broader economy, but our focus has been on standing alongside those we serve. While our performance reflects these pressures, our actions are guided by a long-term view — supporting our customers today while safeguarding the strength of our business for the future.”
Staff Costs Surge 33.7% With No Explanation From the Board
Costs added further pressure where they were least expected. Total operating expenses rose a modest 2.4% to KSh 7.16 billion in aggregate, but the composition of that movement demands scrutiny. Staff costs surged 33.7% to KSh 3.89 billion from KSh 2.91 billion, an increase of KSh 980 million in a single quarter that the board’s accompanying statement did not address.
That omission matters. A near-KSh 1 billion jump in staff costs, representing the single largest driver of margin deterioration outside of revenue compression, warrants a direct explanation for investors and analysts. Whether it reflects restructuring charges, deferred compensation, new hires ahead of a growth phase, or something else entirely remains unclear.
The cost-to-income ratio deteriorated to 48.9% from 44.3% — the worst reading since 2020 — confirming that cost growth is now outpacing revenue recovery.
The Balance Sheet Holds Firm
Away from the income statement, the balance sheet tells a more resilient story. Total assets grew 6.3% to KSh 571.3 billion, customer deposits rose 7.2% to KSh 399.1 billion, and gross non-performing loans improved 13.5% to KSh 38.11 billion, the first meaningful asset quality improvement in four years.
That NPL improvement carries genuine significance. It suggests the credit stress that built up through the 2023 and 2024 period is beginning to resolve, reducing the provisioning burden and freeing capital for productive deployment.
Government securities holdings jumped 21.3% to KSh 128.46 billion as the bank rotated capital away from credit risk toward sovereign paper. That rotation preserves yield while limiting exposure to commercial credit in a period where private sector demand remains subdued.
Moses Muthui, Consumer Banking Director, pointed to momentum building within the retail book. “Q1 2026 banking results tell us the recovery cycle is underway, for both the industry and the economy. Absa Retail recorded a 10% growth in income driven by a 17% growth in customer transacting activity,” he said.
Twenty Years of Growth and One Inflection Point
The long-run context matters here. Over two decades, Absa Kenya has grown total assets from KSh 109.4 billion in Q1 2006 to KSh 571.3 billion today, compounding at roughly 8% annually. Profit after tax grew from KSh 820 million to a peak of KSh 6.17 billion in Q1 2025 before the current pullback. This is a bank with a demonstrably strong long-run trajectory absorbing a specific, rate-driven cyclical shock.
Whether Q1 2026 marks a trough or the beginning of a more extended compression depends on two things the bank does not fully control: how quickly the CBK continues its easing cycle, and how fast private sector credit demand recovers to absorb the capital the bank currently parks in government securities.
What it does control and what investors will watch closely in the quarters ahead — is that KSh 980 million staff cost increase. An explanation is overdue.
