


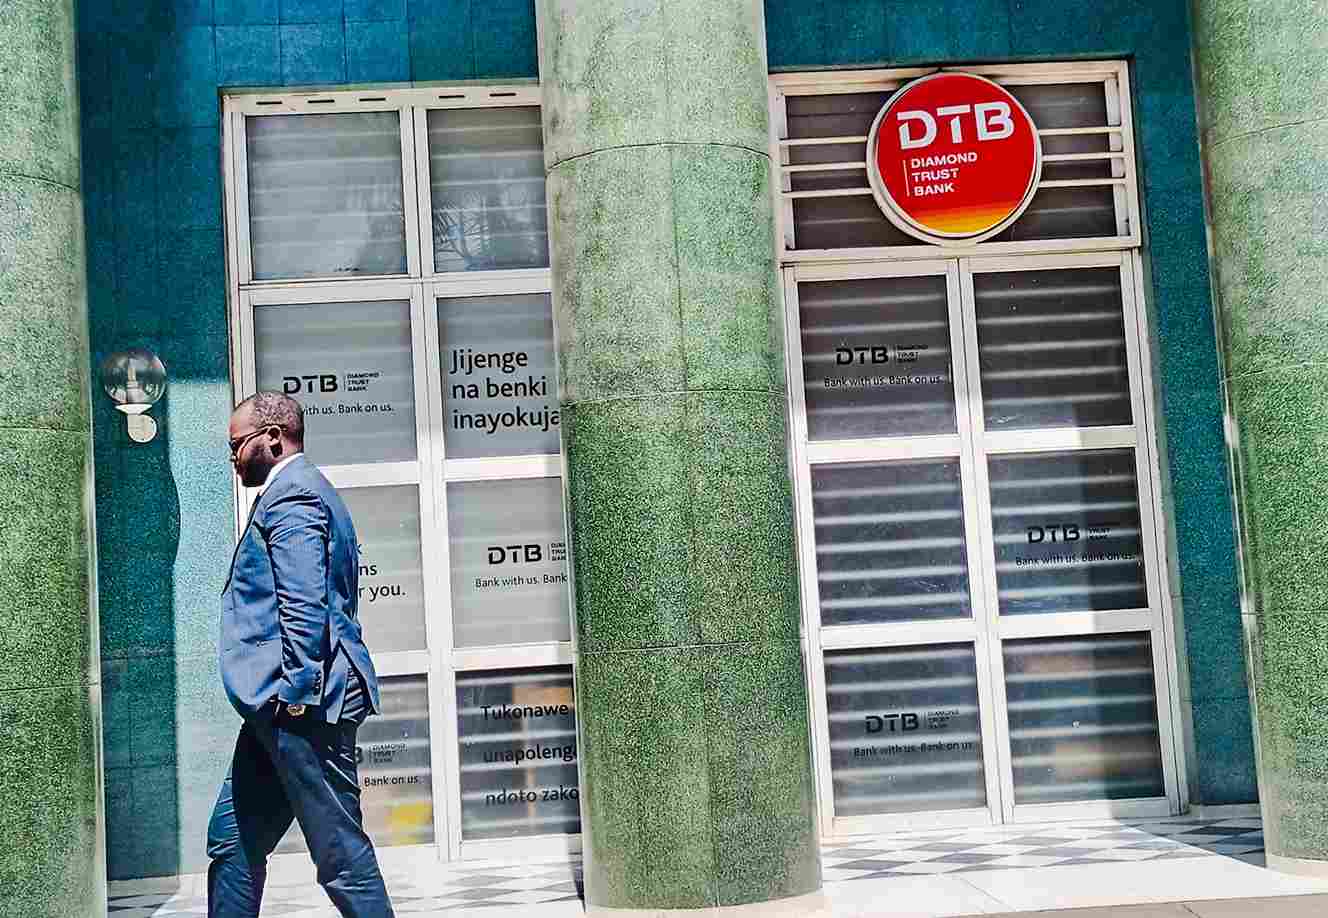
Diamond Trust Bank Kenya earned its sharpest net interest income growth in recent memory, posting a first quarter profit after tax of KSh 3.5 billion for the three months to March 2026, up 7.7% from KSh 3.2 billion a year earlier.
The result was driven by widening interest margins and falling funding costs, though a 151.8% surge in loan loss provisions limited how far that income gain translated into bottom line growth.
Falling Funding Costs Power a 30.9% Jump in Net Interest Income
Interest income rose 10.3% to KSh 16.2 billion, while interest expenses fell 12.2% to KSh 6.1 billion as deposit repricing tracked Central Bank of Kenya rate cuts lower. Customer deposit costs dropped 11.3% to KSh 5.8 billion even as the deposit book grew 10.4% to KSh 511.9 billion.
That combination widened the net interest spread by 1.3 percentage points to 6.7% and pushed net interest income up 30.9% to KSh 10.0 billion. Net interest margin expanded by 1.2 percentage points to 7.0%, reflecting both improved asset deployment and tighter liability management. Total operating income grew 21.2% to KSh 12.9 billion as a result.
Non-funded income, however, moved in the opposite direction, falling 3.2% to KSh 2.9 billion, weighed down by a 17.1% drop in other income to KSh 0.6 billion. That decline shifted the revenue mix to 77:23 in favour of funded income, from 72:28 a year earlier, narrowing the bank’s income diversification.
Q1 2026 Key Financial Summary
| Metric | Q1 2025 | Q1 2026 | Change |
|---|---|---|---|
| Net Interest Income (KSh bn) | 7.7 | 10.0 | +30.9% |
| Non-Funded Income (KSh bn) | 3.0 | 2.9 | -3.2% |
| Total Operating Income (KSh bn) | 10.7 | 12.9 | +21.2% |
| Loan Loss Provisions (KSh bn) | 0.9 | 2.2 | +151.8% |
| Total Operating Expenses (KSh bn) | 6.6 | 8.1 | +22.9% |
| Profit Before Tax (KSh bn) | 4.1 | 4.8 | +18.6% |
| Profit After Tax (KSh bn) | 3.2 | 3.5 | +7.7% |
| Core EPS (KSh) | 11.5 | 12.4 | +7.7% |
| Net Interest Margin | 5.8% | 7.0% | +1.2pp |
| Cost of Funds | 6.5% | 5.0% | -1.5pp |
| Gross NPL Ratio | 13.2% | 11.8% | -1.5pp |
| Loan to Deposit Ratio | 61.3% | 63.2% | +1.9pp |
| Total Assets (KSh bn) | 595.1 | 660.9 | +11.1% |
| Core Capital / Risk Weighted Assets | 15.4% | 15.3% | -0.1pp |
Provisions More Than Double as the Bank Builds Credit Buffers
The most significant cost pressure in the quarter came from provisioning. Loan loss provisions jumped 151.8% to KSh 2.2 billion from KSh 0.9 billion in Q1 2025, the single largest driver of a 22.9% increase in total operating expenses to KSh 8.1 billion. That rise outpaced income growth and nudged the cost to income ratio up 0.9 percentage points to 62.8%.
The scale of the provision increase stands in contrast to a relatively modest 2.8% rise in gross non-performing loans to KSh 40.8 billion. The gross NPL ratio actually improved, falling 1.5 percentage points to 11.8% as gross loan growth of 15.5% outpaced impaired loan growth. That divergence suggests management built forward provisions ahead of any deterioration rather than in response to it, consistent with IFRS 9 forward-looking requirements and a cautious read of the operating environment, particularly within segments of the SME sector. Excluding provisions, the cost to income ratio improved sharply to 45.6% from 53.7%, signalling that the underlying operating base remains efficient.
“The bank’s diversified regional footprint, trade finance positioning and corporate banking franchise remain major strengths,” said Dedan Maina, CFA at Ketu Capital. “Credit quality trends and provisioning behaviour will likely remain central to investor attention through 2026. The results point to a bank still growing strongly, but prioritising balance sheet protection as it navigates a transitioning credit cycle.”
Balance Sheet Grows as Capital Stays Above Regulatory Floors
Total assets grew 11.1% to KSh 660.9 billion, supported by a 13.8% expansion in net loans and advances to KSh 323.6 billion and a 16.7% increase in government securities holdings to KSh 159.8 billion. Loan growth outpaced deposit growth, lifting the loan to deposit ratio by 1.9 percentage points to 63.2%.
Shareholders’ funds grew 21.5% to KSh 105.6 billion, supported by an 11.4% increase in retained earnings to KSh 74.7 billion. The core capital to risk weighted assets ratio stood at 15.3%, 4.8 percentage points above the statutory minimum of 10.5%. The total capital ratio came in at 16.6%, exceeding the 14.5% regulatory floor by 2.1 percentage points. Return on average equity held at 11.4%, roughly in line with the 11.5% recorded in Q1 2025.
A Regional Franchise With Room to Grow
DTB has operated in East Africa for over 70 years as an affiliate of the Aga Khan Development Network and trades on the Nairobi Securities Exchange. The bank runs 92 branches in Kenya, 36 in Uganda, 29 in Tanzania and 4 in Burundi, with a focus on SME banking alongside growing exposure to agriculture, education and fintech.
The non-funded income decline underscores the case for deeper diversification. DTB’s DTB Weza platform, diaspora banking products and bancassurance offerings represent the clearest pathways to rebuilding fee income as the interest rate tailwind eventually moderates.
Analysts rate DTB Kenya a buy with a target price of KSh 164.5, representing a 10.2% upside from the 15 May 2026 price of KSh 149.3. The stock trades at a price to tangible book value of 0.4x and a price to earnings ratio of 3.8x, against an industry average of 1.3x and 5.7x respectively, suggesting the market has yet to fully price in the bank’s improving income trajectory.
