



Kenya’s annual inflation rate climbed to 6.7% in May 2026, up from 5.6% in April, pushed by rising fuel costs, a collapse in vegetable supply, and persistent pressure on household essentials. The reading marks the highest rate since January 2024 and places inflation near the upper limit of the Central Bank of Kenya’s preferred band of 2.5% to 7.5%.
The Kenya National Bureau of Statistics released the figures on Friday. Transport, food, and housing costs together account for 57% of the inflation basket’s weight and all three moved higher in May.
The timing sharpens focus on the CBK’s next Monetary Policy Committee meeting, scheduled for June 9. The central bank held its benchmark rate unchanged at its April meeting, citing the need to monitor the effects of rising oil prices. With inflation now accelerating, the June decision carries more weight than any MPC meeting since 2024.
Transport Costs Lead the Surge
Transport recorded the largest annual increase of any category, rising 16.5% in the twelve months to May 2026, up sharply from 10% in April. The government raised fuel prices in both April and May in response to a surge in global energy costs driven by the conflict in the Middle East, triggering protests and a transport operator strike that left commuters stranded across major towns.
Between April and May alone, diesel prices rose 18.4% — the steepest monthly jump among fuel types — while petrol increased 8.4%. Tuk-tuk fares rose 12% during the same period, feeding directly into the cost of daily movement for millions of low-income households who rely on informal transport.
Vegetables Record Steep Price Increases
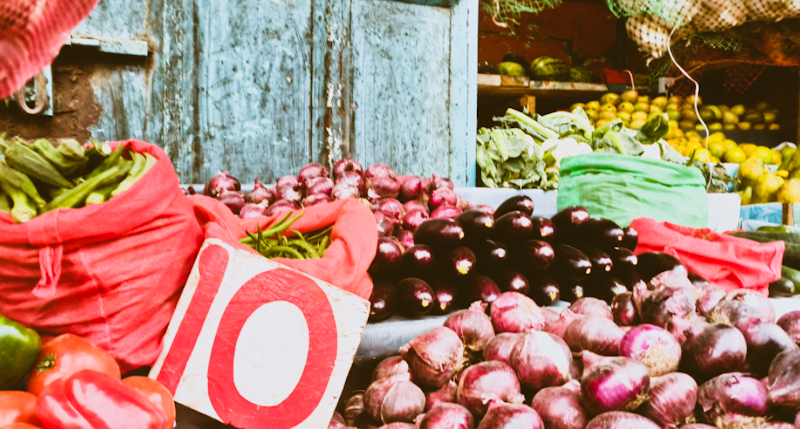
Food and non-alcoholic beverages rose 9.4% annually, contributing 2.7 percentage points to overall inflation in May. Within that category, vegetables drove the sharpest increases.
Tomatoes recorded an 11.2% rise between April and May 2026 alone — the highest monthly increase of any commodity tracked in the CPI basket. Year on year, tomato prices climbed 45.7%, from KSh 82.88 per kilogram in May 2025 to KSh 120.75 in May 2026.
The spike traces back to a supply shock. Heavy rains flooded farms across key producing regions, destroying seedlings and causing widespread crop rot during the flowering and fruiting stages. Flooding on rural roads slowed produce movement to urban markets, while high spoilage rates reduced supply further. In Kirinyaga, traders reported that a crate of tomatoes that sold for around KSh 300 earlier in the year jumped to between KSh 5,000 and KSh 10,000 depending on availability. In some Nairobi markets, a single tomato reached KSh 25.
Many farmers had already cut back production following price volatility in previous seasons, creating a supply gap that the rains then made significantly worse.
May 2026 Vegetable Price Movements
| Vegetable | May 2025 (KSh/kg) | April 2026 (KSh/kg) | May 2026 (KSh/kg) | Monthly Change | Annual Change |
|---|---|---|---|---|---|
| Tomatoes | 82.88 | 108.60 | 120.75 | +11.2% | +45.7% |
| Spinach | 102.15 | 115.16 | 121.11 | +5.2% | +18.6% |
| Cabbages | 52.69 | 69.15 | 72.61 | +5.0% | +37.8% |
| Kale (Sukuma Wiki) | 89.53 | 106.86 | 110.07 | +3.0% | +22.9% |
Spinach rose 5.2% month on month and 18.6% year on year. Cabbages gained 5.0% in the month and 37.8% over the year. Kale, the most widely consumed green vegetable in Kenyan households, rose 3.0% between April and May and 22.9% over the twelve months to May 2026.
Cooking oil rose from KSh 348.74 to KSh 355.79, while a 2kg pack of maize flour reached KSh 159.12. Beans and oranges bucked the trend, declining 0.4% and 0.2% respectively between April and May.
Housing and Energy Costs Add Pressure
The housing, water, electricity, gas, and fuels category recorded an annual increase of 3.4%. The picture within the category was uneven. Electricity prices for households consuming 50 kWh and 200 kWh fell 2.4% and 2.2% respectively between April and May — a marginal relief for lower-consumption households. Kerosene, which remains the primary cooking and lighting fuel for a large share of low-income urban and rural households, rose 25.3% in the same period, largely cancelling out any benefit from lower electricity tariffs.
Other Price Movements Across the Basket
Core inflation contributed 3.8 percentage points to the overall May reading, while non-core inflation contributed 2.9 percentage points.
Beer and cigarettes edged up 0.2% and 0.1% respectively between April and May, while miraa rose 3.0%. Laundry soap increased 0.5% and detergents 0.9%, while blanket prices fell 0.1%. Clothing and footwear rose 2.0% over the twelve months to May. Prices of girls’ dresses, men’s shirts, and women’s dresses each increased 0.6% between April and May.
In health, prices of cholesterol and blood pressure medicines rose 0.4%, general practitioner consultation fees increased 0.1%, and delivery charges climbed 0.8% between April and May.
What Comes Next
With inflation at its highest point in 16 months and three of the basket’s heaviest categories moving in the wrong direction simultaneously, the CBK faces a difficult judgment on June 9. Cutting rates further risks stoking price pressures that are already testing the upper bound of the target range. Holding steady preserves the inflation anchor but extends the period of tight monetary conditions for an economy still working through the effects of last year’s slowdown.
The answer may rest on whether the tomato and transport price spikes prove temporary — supply-driven shocks that reverse as rains ease and roads clear — or the start of a more sustained inflation cycle. The June data will tell a great deal.
