




Kenya’s cost of living rose again in July, reversing June’s brief easing and keeping households squeezed by expensive fuel, pricier food and rising electricity bills.
Annual inflation reached 6.5 per cent in July, up from 6.4 per cent in June, according to data released Friday by the Kenya National Bureau of Statistics (KNBS). The reading came in just below the 6.7 per cent forecast by the Central Bank of Kenya (CBK), but it marks the third straight month that inflation has sat above the midpoint of the bank’s target band of 2.5 to 7.5 per cent.
On a month to month basis, consumer prices ticked up 0.2 per cent, with the overall Consumer Price Index rising from 154.91 in June to 155.20 in July. The increase means Kenyan households paid more for a typical basket of goods and services than they did a year earlier, even as a handful of food staples got cheaper.
Transport remains the biggest driver
Transport costs rose 15.6 per cent compared with a year earlier, by far the sharpest increase of any spending category and the main force behind July’s uptick. KNBS traced the pressure to the lagged effects of fuel price hikes earlier in the year, even though pump prices held steady during the latest monthly review.
Petrol and diesel both stayed flat in July, at Ksh214.95 and Ksh224.04 per litre respectively. But those prices tell only part of the story. Diesel cost 29.7 per cent more than it did a year ago, and petrol was up 14.7 per cent. City bus and matatu fares climbed 16.8 per cent over the same period, a cost that ripples through supply chains as manufacturers, retailers and farmers pass on higher distribution expenses to consumers.
Fuel has been the standout story of 2026. A Middle East driven supply shock sent landed costs soaring in the first half of the year, forcing the government to cut value added tax on petroleum products and draw billions of shillings from the Petroleum Development Levy Fund to keep pump prices from spiralling further. The price swings were sharp enough to trigger a nationwide matatu strike in May, when diesel briefly hit an all time high of Ksh242.92 per litre before regulators revised it down.
How pump prices moved since January
| Pricing period | Super petrol (Ksh/litre) | Diesel (Ksh/litre) | Kerosene (Ksh/litre) |
|---|---|---|---|
| January to mid March | around 174 to 178 | around 164 to 166 | 152.78 |
| April 15 to May 14 | 206.97 | 206.84 | 152.78 |
| May 15 to June 14 (revised May 19) | 214.25 | 232.86 | 191.38 |
| June 15 to July 14 | 214.03 | 222.86 | 191.38 |
| July 15 to August 14 | 214.95 | 224.04 | 191.38 |
Diesel has climbed roughly 35 per cent since the start of the year despite the recent easing, and kerosene is up by more than a quarter. That gap explains why transport inflation has stayed in double digits even in months when pump prices did not move.
Food prices ease slightly, but the annual picture is still steep
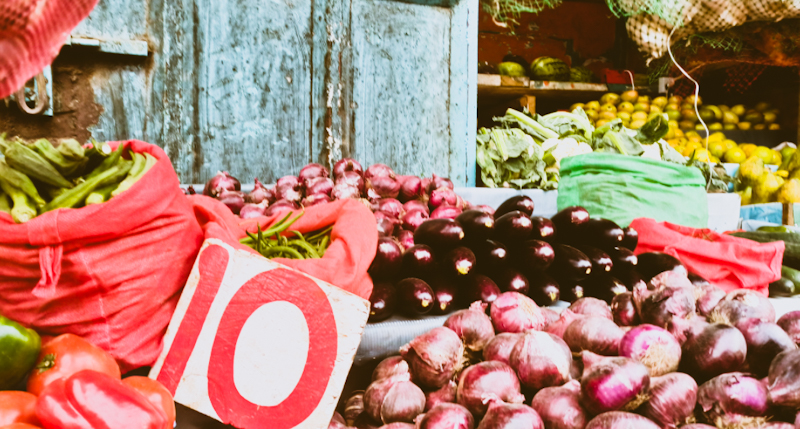
Food and non alcoholic beverages, the single biggest category in the inflation basket, rose 9.0 per cent compared with a year earlier. Some relief showed up within the month itself. Tomatoes fell 3.7 per cent between June and July, carrots dropped 3.6 per cent and sifted maize flour eased 1.6 per cent.
Other items moved the other way. Potatoes rose 2.1 per cent, mangoes climbed 3.2 per cent, and both beef and kale became more expensive. Food alone contributed 2.6 percentage points to overall inflation, more than any other category, according to KNBS.
Housing and energy costs keep climbing
Housing, water, electricity, gas and other fuels rose 3.2 per cent year on year. Refilling a 13 kilogram LPG cylinder actually got cheaper, down 1.1 per cent during the month. Electricity told a different story: tariffs for households using 50 kilowatt hours a month rose 3.5 per cent, while those consuming 200 kilowatt hours climbed 3.1 per cent. House rents also edged higher.
The rest of the basket
Inflation touched nearly every corner of household spending in July, though most categories moved far more gently than transport or food. Health, clothing, restaurants, education and household goods all rose between two and three per cent. Information and communication stayed the calmest category in the basket, up just 0.6 per cent, while insurance and financial services rose 0.8 per cent.
| Category | Annual change (%) |
|---|---|
| Transport | 15.6 |
| Food and non alcoholic beverages | 9.0 |
| Education services | 3.1 |
| Housing, water, electricity, gas and other fuels | 3.2 |
| Restaurants and accommodation services | 2.9 |
| Health | 2.8 |
| Alcoholic beverages, tobacco and narcotics | 2.6 |
| Recreation, sport and culture | 2.5 |
| Furnishings, household equipment and maintenance | 2.4 |
| Personal care, social protection and miscellaneous goods and services | 2.4 |
| Clothing and footwear | 2.2 |
| Insurance and financial services | 0.8 |
| Information and communication | 0.6 |
| Total | 6.5 |
Food, transport and housing together make up more than 57 per cent of the weight in Kenya’s inflation basket, which is why swings in those three categories tend to move the headline number the most, KNBS director general Macdonald Obudho noted.
What the trend line shows
July’s reading fits into a year that started calm and turned volatile fast. Inflation opened 2026 at 4.4 per cent in January, cooled to a seven month low of 4.3 per cent in February, then began climbing once fuel markets seized up. April brought a jump to 5.6 per cent as the diesel shock hit. May pushed inflation to 6.7 per cent, its highest point of the year, before easing slightly to 6.4 per cent in June. July’s 6.5 per cent puts the rate back on an upward path.
| Month (2026) | Annual inflation (%) |
|---|---|
| January | 4.4 |
| February | 4.3 |
| March | 4.4 |
| April | 5.6 |
| May | 6.7 |
| June | 6.4 |
| July | 6.5 |
Strip out volatile food and energy prices, and the picture looks steadier. Core inflation, which excludes those items, was just 3.2 per cent in July, up slightly from 3.1 per cent in June. Non core inflation, dominated by food and fuel, remained elevated at 15.0 per cent, underlining how much of the current squeeze traces back to those two categories rather than a broader spiral in prices.
What comes next for households
Kenya’s inflation rate remains within the CBK’s target band, and July’s figure came in below what policymakers had projected. That offers some reassurance that price growth has not spun out of control. Still, the gap between core and non core inflation tells the real story: as long as fuel costs stay elevated and food prices remain sensitive to weather and supply shocks, transport will keep acting as a tax on nearly everything else Kenyan households buy.
Government interventions, including the VAT cuts on fuel and subsidies from the Petroleum Development Levy Fund, have softened the blow so far. Whether they can hold the line if global oil prices climb again is the question that will shape Kenya’s cost of living through the rest of the year.
