Kenya’s economic growth slowed to 4.7% in 2024 from 5.7% in 2023, driven by global headwinds, tight financial conditions, and fading post-pandemic momentum.
This marked the weakest annual expansion since the 2020 pandemic-induced contraction of -0.3% and, excluding that year, the slowest since 2013’s 3.8% growth amid post-election uncertainty.
The deceleration stemmed primarily from a contraction in construction and mining and quarrying, alongside slower growth in most sectors, except manufacturing, wholesale and retail trade, public administration, education, health, and taxes on products.
GDP by Sector: Contribution to Nominal GDP (2020–2024)
| Sector | 2020 | 2021 | 2022 | 2023 | 2024* |
|---|---|---|---|---|---|
| Agriculture, Forestry and Fishing | 22.7% | 21.5% | 21.0% | 21.5% | 22.5% |
| Transportation and Storage | 10.8% | 11.6% | 13.2% | 13.2% | 12.7% |
| Real Estate | 9.3% | 9.0% | 8.5% | 8.4% | 8.4% |
| Financial and Insurance Activities | 6.7% | 7.2% | 7.4% | 7.8% | 7.9% |
| Wholesale and Retail Trade | 8.1% | 7.9% | 7.7% | 7.7% | 7.5% |
| Manufacturing | 7.6% | 7.4% | 7.7% | 7.5% | 7.3% |
| Construction | 7.0% | 7.1% | 7.1% | 6.7% | 6.3% |
| Public Administration and Defence | 5.5% | 5.3% | 5.0% | 4.9% | 5.0% |
| Others (combined) | 22.3% | 22.9% | 22.4% | 20.3% | 21.4% |
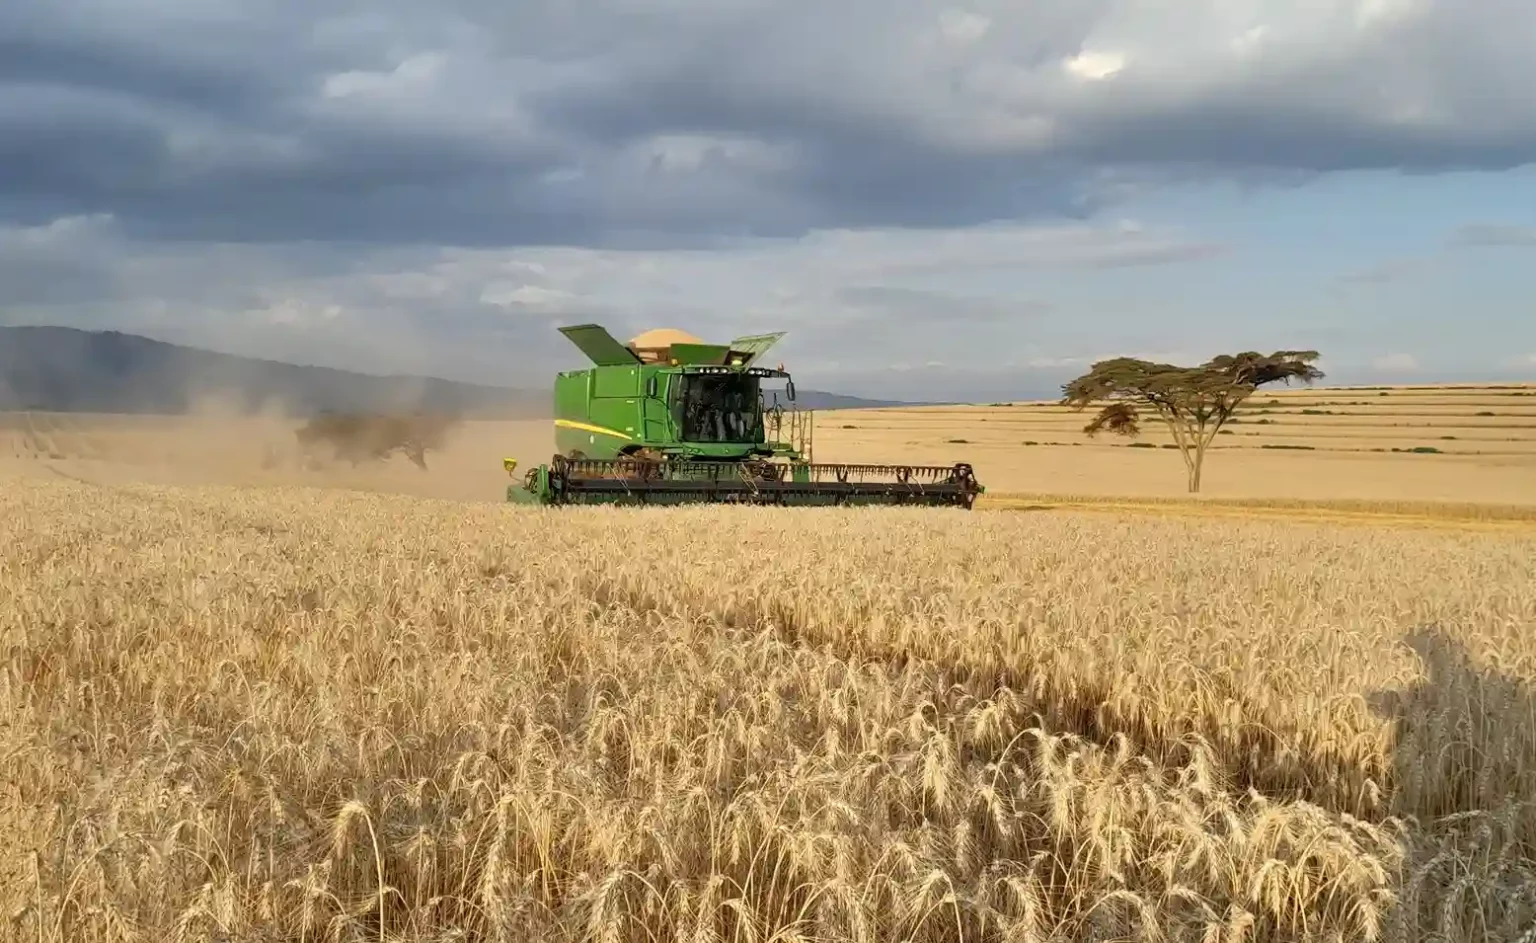
Agriculture grew by 4.6% in 2024, down from 6.6% in 2023, supported by higher production of sugarcane, tea, and coffee, though constrained by lower maize and potato yields.
Services remained resilient, growing by 6.0% compared to 7.0% in 2023, driven by financial and insurance, transport and storage, real estate, information and communication, and wholesale and retail trade.
Industrial growth weakened to 0.8% from 2.0% in 2023, largely due to declines in construction and mining.
Nominal GDP reached KSh 16.22 trillion in 2024, with real GDP (2016 prices) at KSh 10.91 trillion.
Nominal GDP per capita surpassed KSh 300,000 for the first time, reflecting income gains.
Real GDP per capita rose modestly to KSh 208,061, indicating subdued inflation-adjusted improvements in living standards.
Nominal GDP and Per Capita Indicators (2020–2024)
| Year | Nominal GDP (KSh Billion) | Real GDP (KSh Billion) | Real GDP Growth (%) | GDP Per Capita (KSh, Nominal) | GDP Per Capita (KSh, Constant) |
|---|---|---|---|---|---|
| 2020 | 10,715.1 | 8,733.1 | -0.3% | 219,492 | 178,892 |
| 2021 | 12,027.7 | 9,395.9 | 7.6% | 241,907 | 188,976 |
| 2022 | 13,489.6 | 9,852.6 | 4.9% | 266,473 | 194,627 |
| 2023 | 15,033.6 | 10,416.2 | 5.7% | 291,770 | 202,155 |
| 2024* | 16,224.5 | 10,908.3 | 4.7% | 309,460 | 208,061 |
Kenya’s GDP remains consumption-driven, with private consumption accounting for 76.9% of GDP in 2024. Investment in dwellings and transport equipment supported capital formation, but industrial investment lagged.
Agriculture showed recovery, and services, particularly transport and finance, remained robust, while manufacturing and construction faced challenges.
Key Risks
- Weakening global growth and potential export declines.
- Heavy dependence on private consumption.
- Low industrial investment.
Opportunities
- Agricultural recovery.
- Resilient service sector.
- Improving external balances.
Provisional data from the Economic Survey 2025 highlights sustained consumer demand, agricultural recovery, and stronger external balances as key supports, offering cautious optimism despite growing challenges.


