



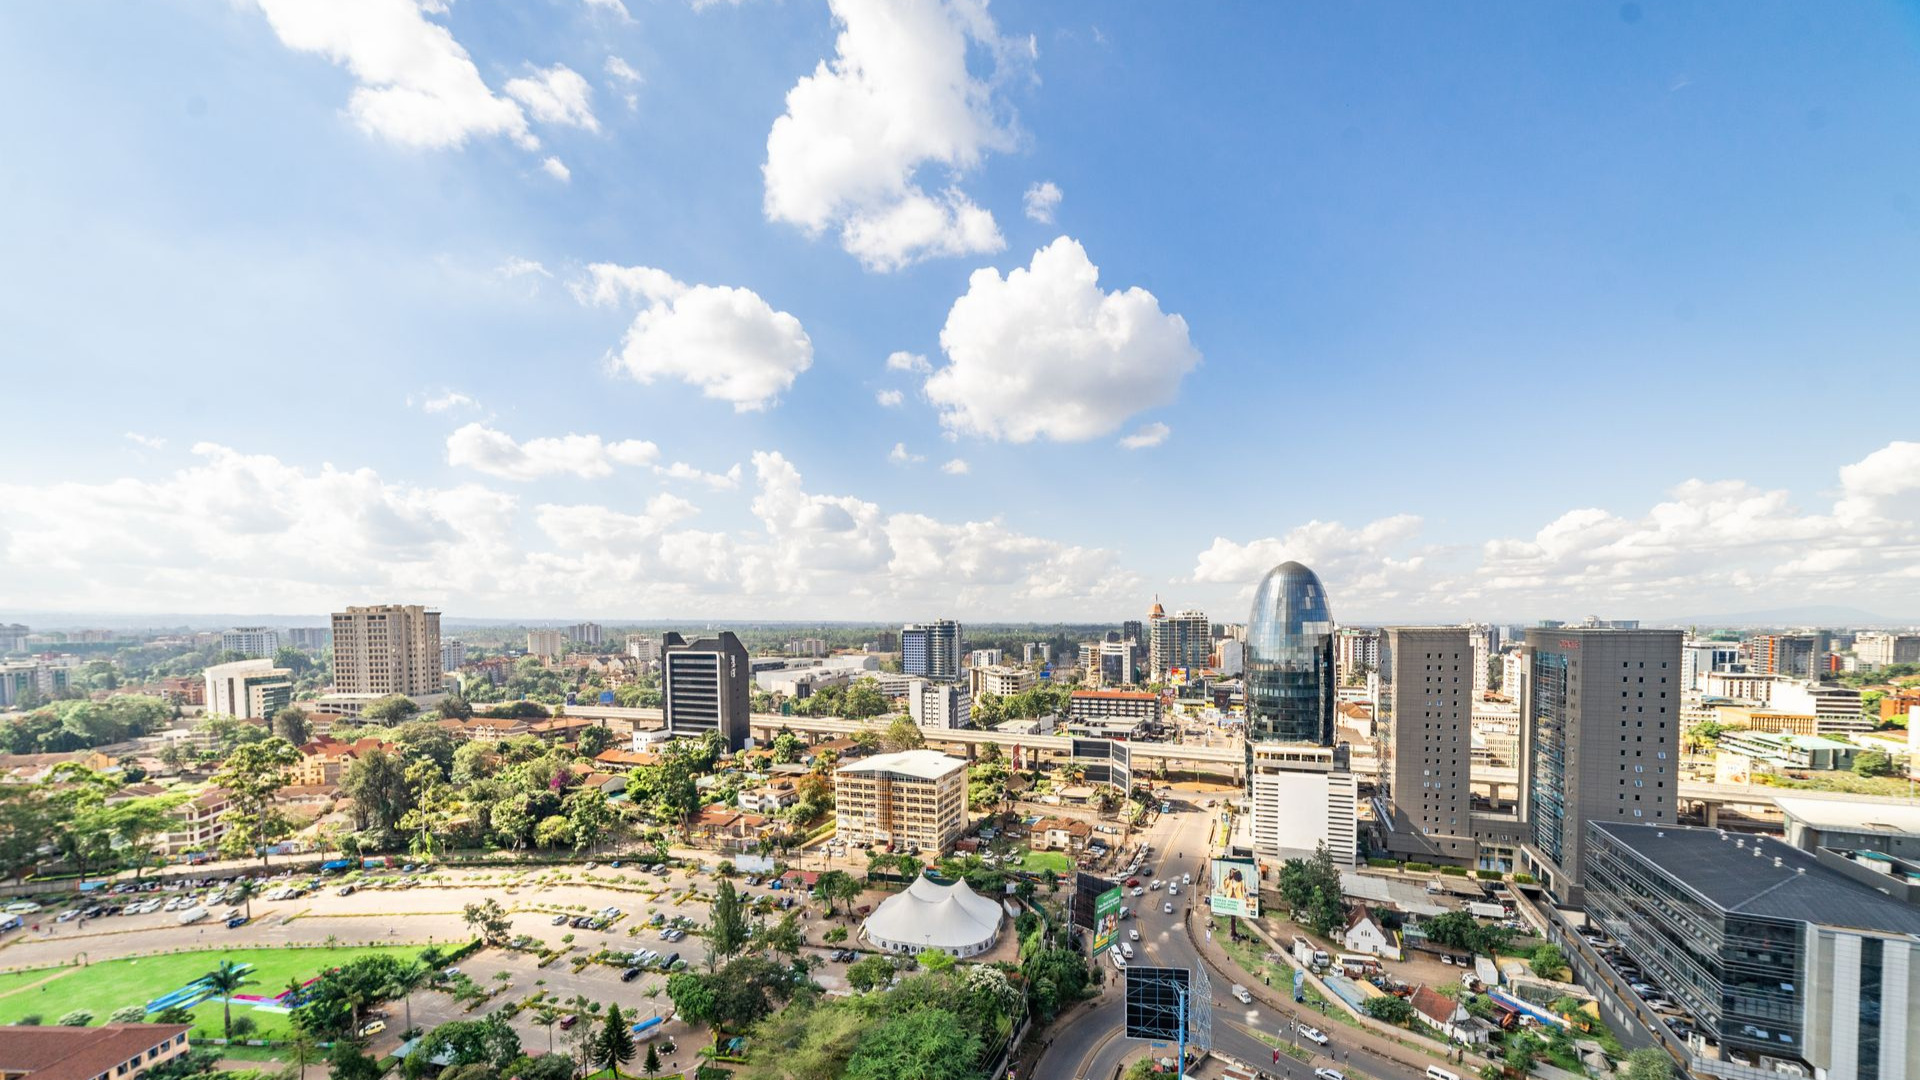
Nairobi’s land market bounced back sharply in the second quarter of 2026, with suburb prices growing 1.4 percent after a policy shift cleared up planning uncertainty that had kept developers on the sidelines.
Property prices told a more divided story: Nairobi’s suburbs kept extending a recovery in house sales even as satellite towns continued to soften, according to the latest HassConsult Property and Land Price Indices.
Land prices accelerate
Land in Nairobi’s suburbs grew 1.4 percent in the quarter, nearly double the 0.8 percent recorded in the first three months of the year. Langata led every suburb with a 4.1 percent gain, followed by Karen at 3.2 percent, Runda at 2.9 percent and Nyari at 2.5 percent.
The publishing of the Nairobi City County Development Control Policy 2026 gets much of the credit for the turnaround. The policy addressed uncertainty over planning approvals that had left developers hesitant to commit to new projects since late 2025, when questions over the validity of county approvals slowed land acquisitions across the city.
“Karen and Langata recorded their strongest quarterly price growth in a decade as demand increasingly shifted towards suburbs offering relatively lower land acquisition costs for both residential developers and individuals building their own homes,” said Sakina Hassanali, HassConsult’s co-CEO and creative director.
That shift toward affordability shows up clearly in the numbers. An acre in Langata now costs Kshs 94.7 million, and an acre in Karen goes for Kshs 79.5 million, both well below the Kshs 261.1 million average in Gigiri or the Kshs 568.7 million commanded in Upperhill. Not every suburb joined the rally. Muthangari posted the weakest performance in the city, falling 2.11 percent for the quarter and 4.92 percent over the year, while Gigiri and Muthaiga also recorded quarterly declines.
Satellite towns followed a similar pattern, growing 1.4 percent after just 0.5 percent in the first quarter, itself the slowest pace of satellite town land growth in five years. Ruiru led the recovery with a 4.1 percent quarterly gain to Kshs 42.2 million per acre, trailed by Thika at 3.8 percent to Kshs 32.4 million and Ruaka at 2.8 percent to Kshs 115.7 million.

“The recovery across Nairobi’s satellite towns is becoming increasingly selective. Growth is concentrating in locations with strong economic and infrastructure drivers, including employment hubs, major transport investments and expanding commercial centres that create sustained demand for development,” Hassanali said.
Ruiru’s gains trace directly to large mixed use developments such as Tatu City and Northlands, which have drawn workers into the area and lifted housing demand alongside them. Thika’s land prices are climbing as the town prepares for its imminent elevation to city status, while Ruaka has benefited from the completed Nairobi Western Bypass and its position on the edge of the UN Blue Zone. Even so, seven of the 14 satellite towns still posted negative growth for the quarter, led by Ngong at negative 2.5 percent and Limuru at negative 0.8 percent.
Land Price Index, Q2 2026
| Segment | Quarter change | Annual change | Since 2016 |
|---|---|---|---|
| Nairobi suburbs composite | 1.35% | 4.82% | 1.29 fold |
| Nairobi satellite towns composite | 1.45% | 4.49% | 1.88 fold |
| Top suburb (quarter) | Langata, +4.14% | ||
| Top suburb (annual) | Karen, +9.99% | ||
| Top satellite town (quarter) | Ruiru, +4.06% | ||
| Top satellite town (annual) | Ruiru, +13.33% | ||
| Weakest suburb | Muthangari, -2.11% | ||
| Weakest satellite town | Ngong, -2.47% |
House prices climb, apartments slide
Nairobi’s residential property market showed a similar split between resilience in the suburbs and continued pressure further out. Average house and apartment prices in Nairobi’s suburbs rose 0.9 percent to Kshs 33.1 million in the second quarter, a step down from 1.1 percent growth in the first quarter but still a fifth straight quarter of gains. Satellite town prices fell 0.6 percent to Kshs 14.52 million, though that marks an improvement from the 0.9 percent contraction recorded three months earlier.
Ridgeways led suburb price growth at 3.4 percent to Kshs 85.2 million, followed by Karen at 3.2 percent to Kshs 113.4 million and Lavington at 3.1 percent to Kshs 82.5 million. All 14 surveyed suburbs posted positive growth for the quarter, a broad based recovery that stands in sharp contrast to the satellite towns, where eight of ten towns recorded falling house prices and six of nine tracked apartment markets posted declines. Ongata Rongai led the retreat at negative 2.7 percent to Kshs 15.6 million, followed by Ngong at negative 2.5 percent to Kshs 19.4 million.
“Despite resilient occupier demand, satellite towns continue to face greater price pressure than Nairobi’s suburbs, reflecting the sensitivity of their buyer base to rising household costs and tighter economic conditions,” Hassanali said.
Inflation shaped much of that pressure. Kenya’s headline rate climbed from 4.4 percent in March to 6.7 percent in May before easing to 6.4 percent in June, squeezing the household budgets of buyers in satellite towns more than those shopping in Nairobi’s established suburbs.
Rents, on the other hand, grew steadily across both markets. Suburb rents rose 1.4 percent for the quarter, led by Runda at 3.4 percent and Ridgeways at 3.2 percent, while satellite town rents grew 1.1 percent, with apartments in Ongata Rongai, Athi River and Mlolongo posting the strongest gains. Property yields held at 7.4 percent in the suburbs and edged up to 5.4 percent in satellite towns, from 5.3 percent the previous quarter.
“The softening of sale prices in satellite towns should be viewed within the context of the property cycle rather than as a weakening of underlying housing demand. While Kenya’s long term housing fundamentals remain intact, individual towns increasingly respond to their own supply and demand dynamics as they mature,” Hassanali said.
Property Price Index, Q2 2026
| Segment | Quarter change | Annual change | Since 2016 |
|---|---|---|---|
| Suburbs sales composite | 0.9% | 2.9% | 2.09 fold |
| Satellite towns sales composite | -0.6% | -0.1% | 3.10 fold |
| Suburbs rental composite | 1.4% | 6.2% | 2.23 fold |
| Satellite towns rental composite | 1.1% | 6.6% | 3.16 fold |
| Suburbs yield | 7.4% | unchanged | |
| Satellite towns yield | 5.4% | up from 5.3% |

A market splitting between houses and apartments
The gap between Nairobi’s suburbs and satellite towns is not the only divide shaping this cycle. Houses and apartments have been moving in opposite directions since the start of the year. Standalone houses across Nairobi’s suburbs have kept climbing on genuinely limited supply, particularly in established areas like Karen, Lavington and Runda where available land for new construction has grown scarce. Apartments have told a different story.
Developers built aggressively in areas such as Westlands and Upperhill in recent years, and that supply has now outpaced demand, pushing apartment sale prices down in several of Nairobi’s most built up neighbourhoods, including a 6.5 percent annual decline in Westlands apartment values, the weakest performer in the entire suburb index this quarter.
Land still beats every other asset class
HassConsult’s own long run comparison underlines why land keeps attracting Kenyan investors despite short term swings. Kshs 1 million invested in Nairobi satellite town land at the end of 2007 would be worth Kshs 13.71 million today, and the same amount put into Nairobi suburb land would have grown to Kshs 7.66 million.
By comparison, that same investment would have reached just Kshs 5.03 million in bonds, Kshs 2.92 million in property overall, Kshs 1.74 million in savings, or a mere Kshs 0.68 million in equities. Average land values in Nairobi’s suburbs have climbed from Kshs 30.3 million in December 2007 to Kshs 231.9 million in June 2026, a run that has comfortably outpaced gold, crude oil and cattle futures over the same period.
What the numbers signal for buyers and investors
Nairobi’s property market enters the second half of 2026 with two clear stories running in parallel. Regulatory clarity has unlocked fresh demand for land, particularly in suburbs where buyers can secure lower acquisition costs, while houses continue to outperform apartments across the city on genuine supply constraints.
For satellite towns, the picture remains more selective: locations tied to real infrastructure and employment growth, like Ruiru and Thika, are pulling ahead, while towns without those drivers continue to lag. Anyone watching Kenya’s property market for the rest of the year should keep an eye on whether that infrastructure driven divide widens further, or whether broader economic relief lets the weaker satellite towns catch up.
